Orthographica
INTERACTIVE ATLAS OF WRITING SYSTEMS • D3.JS
Orthographica: An Atlas of Human Writing
Role: Solo project: data modelling, visualization design, and frontend development
Stack: Vanilla JavaScript (ES6+), D3.js (v7), TopoJSON, Python (data pipeline), CSS
Dataset: 202 scripts catalogued after the ISO 15924 standard
Orthographica is an interactive atlas of the world's writing systems. I brought 202 living, historical, and constructed scripts into one explorable dataset so visitors can follow their lineage, chronology, geographic origins, and visual forms across 5,300 years.
The challenge
A family tree shows how scripts relate, but it cannot show when they appeared or where they began. A map or timeline alone leaves out their visual character. I designed five connected views around the same dataset, with shared filters and details, so people can move between those questions without losing their place.
Five Ways to Read the Data
Lineage
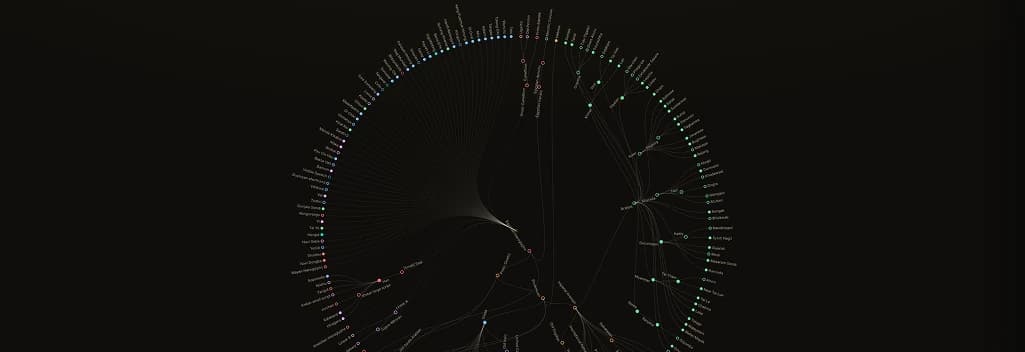
A radial evolutionary tree where every script hangs from its parent and independent inventions radiate from the centre. Filtered-out scripts are dimmed rather than severed, keeping the lineage intact.
Chronology
Timeline bars from 3350 BCE to the present, ordering scripts by the moment they first appeared.
Glyph Field
Force-packed bubble clusters sized by grapheme count and grouped by writing mechanism, revealing the structural diversity of scripts at a glance.
Atlas & Specimens
A geographic map of script origins on a Natural Earth projection, plus a gallery of specimen cards rendering native samples of each system.
Design & Technical Implementation
Encoding is consistent across every view: colour maps to writing mechanism (alphabet, abjad, abugida, syllabary, logographic, featural), while node styling distinguishes living (filled), historical (outlined), and constructed (dashed) scripts. Global filters for status, type, directionality, and free-text search stay in sync across all five visualizations, and deep-linking lets any state be shared by URL.
I maintain the script records in a structured dataset and use a Python pipeline to generate the data consumed by the frontend. D3.js (v7) renders the radial lineage tree, force simulation for the glyph field, and TopoJSON-based atlas. The same filter state drives all five views, while URL deep links let visitors share a specific view or script.
A practical constraint
Native script samples depend on the fonts installed on a visitor's device. When a script has no Unicode encoding or no sample in the dataset, the specimen view shows a clear placeholder instead of implying that the character rendered correctly.